

How to Automatically Color Code in Excel


MS Excel is one of the most powerful and versatile programs in the MS Office bundle. Unless you work with spreadsheets, you probably don’t even use this program, but it is important to realize just how tweakable and programmable it really is. For instance, you could program the Monopoly boardgame using nothing but Excel. Color coding, however, is much easier to use in this great spreadsheet program.
Conditional formatting gives you the ability to automize cell formatting in accordance with the inserted value in MS Excel. The most popular type of conditional formatting in Excel is automatic color coding.
This is very useful for presentation and visualization, but also in instances where creating gradually changing shades (depending on the cell value) is essential in capturing the big picture of a spreadsheet. The best example of this is sorting temperature values by months.
The Big Picture
Jumping right into color coding is certainly a possibility, but, in truth, conditional formatting takes planning before anything else. During the planning process, whenever you come up with a color-coding idea, ask yourself: “Does this make my life simpler or more complicated?” Technically, you could “tell” Excel to color every cell that contains an irrational number red. This is not necessarily a bad idea, but if you also plan to color code it to change shade intensity as the numbers grow, it may end up confusing.
On the other hand, if you’re creating a spreadsheet for a maths class, wanting your irrational number cells to be colored red is a perfectly imaginable and a viable idea. The point is, you shouldn’t jump straight into color coding without actually thinking about how you’re going to make the entire spreadsheet picture become the best it can be. This takes time and a lot of trial and error.

Basic Color Coding Options
There are a number of options that can help you in your color coding task and knowing how each one works will make your job easier.
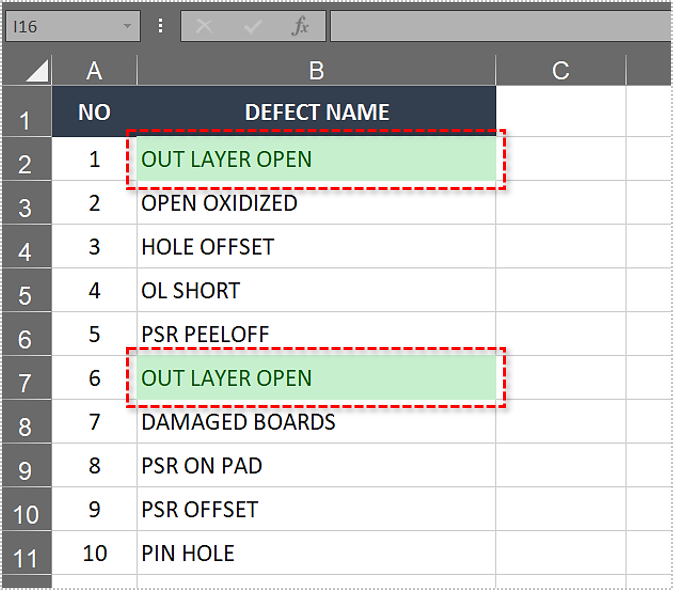
Highlight Duplicates
This is one of the most basic color coding tasks that you give Excel. What it essentially does, is it marks all the duplicate names in the same color. This may help you remove the duplicate names, or may assist you in further spreadsheet analysis. Here’s how to highlight duplicates.
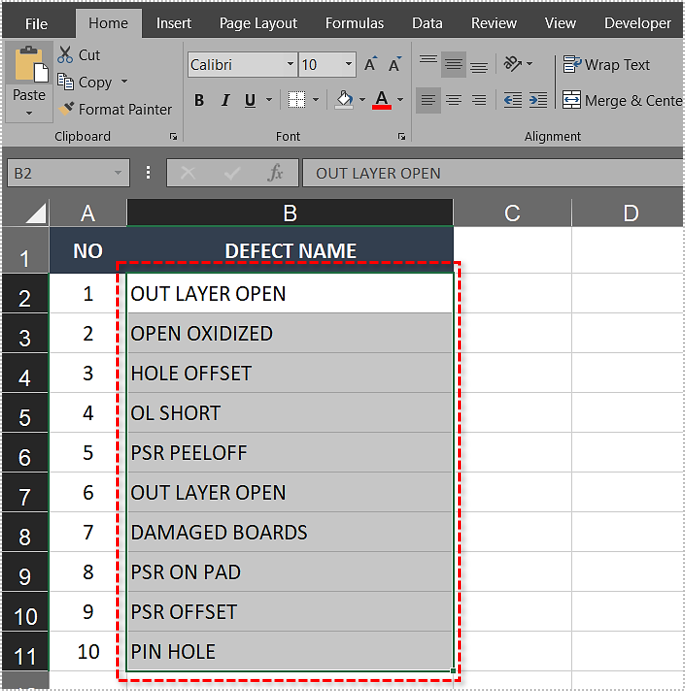
- First, you’ll need to select the range of cells that you want to check for duplicates. Of course, by pressing Ctrl + A, you’ll select every cell in the table.

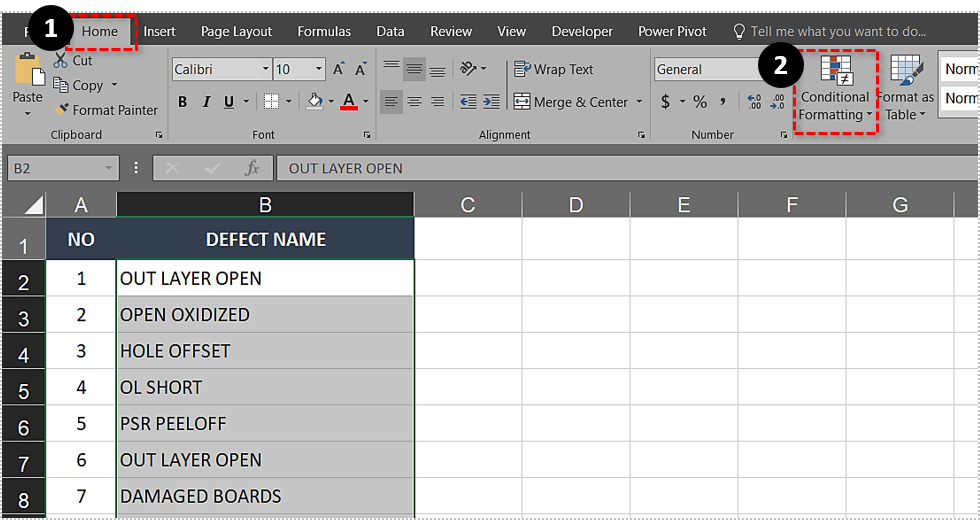
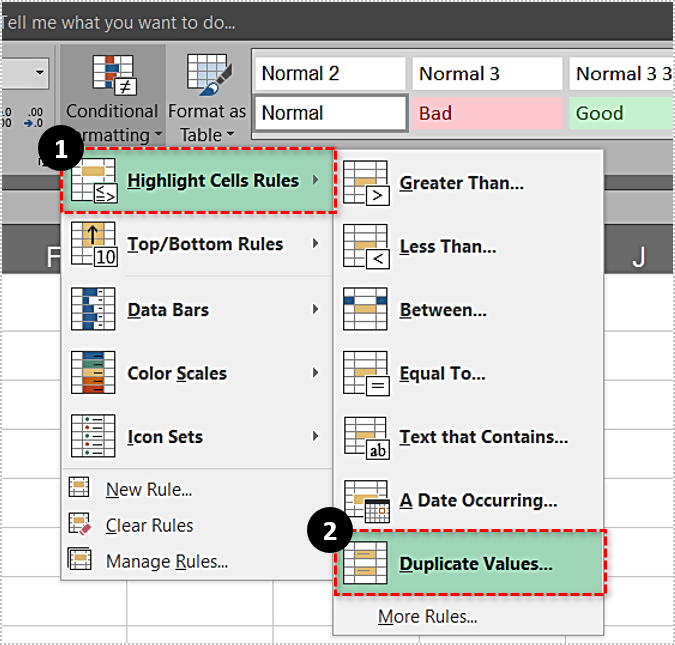
- Go to the Home tab and navigate to Conditional Formatting.

- Under Conditional Formatting, go to Highlight Cell Rules, and then to Duplicate Values.

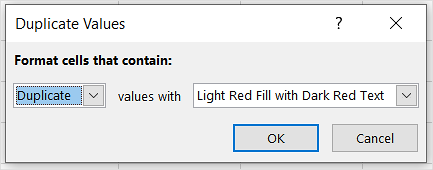
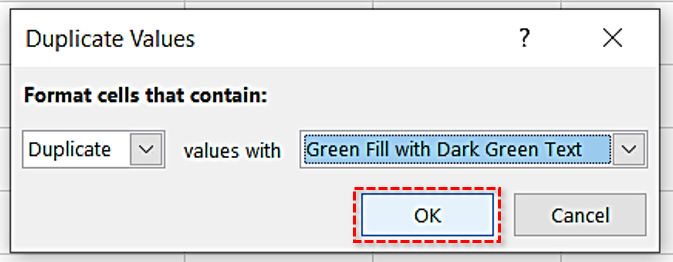
- The Window that pops up offers you to select the format from two drop-down lists.

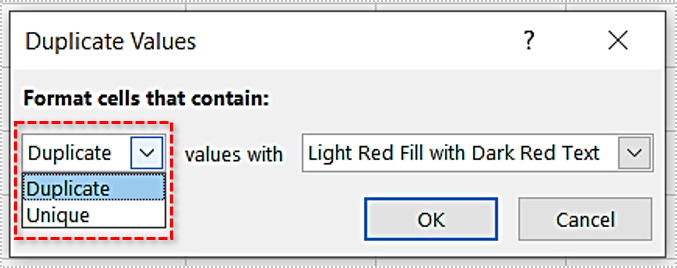
- The first drop-down list allows you to choose which cells you want colored, Duplicate ones or the Unique

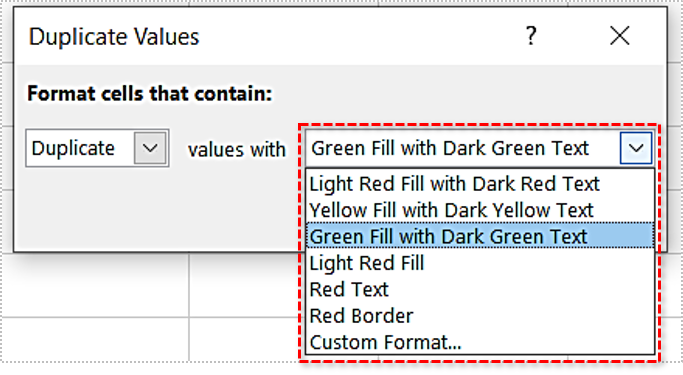
- The second drop-down list offers you a set of available colors.

- Press OK.

Sort by Color
Sorting your list by color takes you a step further from duplicate highlighting. If you’ve highlighted the duplicates, the sort by color option will allow you to sort them together, which works fantastically with larger lists. Here’s how to do it:
- Select the desired data range.
- Go to Data -> Sort & Filter -> Sort.
- Select the desired column in your data range.
- For the Sort on option, select Cell Color.
- Choose a color in the Order
- Select On Top in the final drop-down list.
- Hit OK.
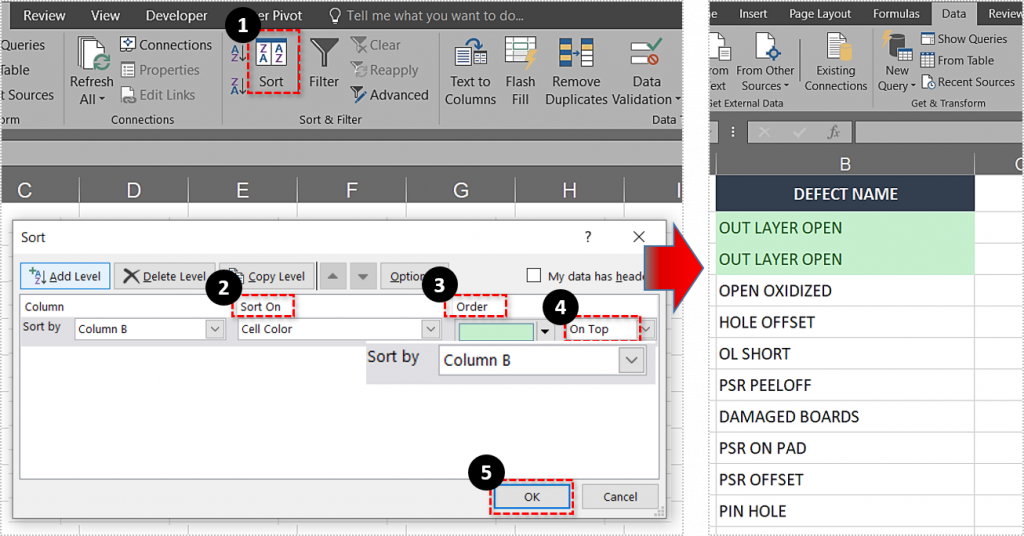
This will sort your list and put the duplicates at the top.
Highlight Top 10
Whether we’re talking about geography, finances, or temperatures, the top 10 items on a list tend to tell a good part of the list’s story. Of course, using the same principle below, you can highlight the bottom 10, top 10%, bottom 10%, above average, below average, and many other data groups.
- Select the desired data range
- Go to the Home
- Click Conditional Formatting.
- Go to Top/Bottom Rules.
- Select Top 10 Items.
- In the window that pops up, adjust the number of options you want (you can do more and less than 10, of course).
- Now select the fill color.
- Hit OK.

Advanced Options
These were some basic color coding options that Excel offers. Now, let’s go over the more advanced tasks. Don’t worry, they aren’t any more complicated than the previous three.
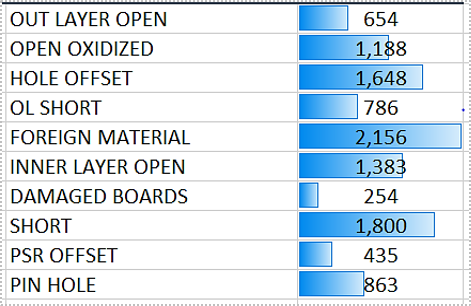
Show Variances with Data Bars
Data bars essentially draws a bar in each cell, with the length corresponding to the cell value of other cells. Here’s a picture to explain it.
Here’s how to select the column/range that you want to format.
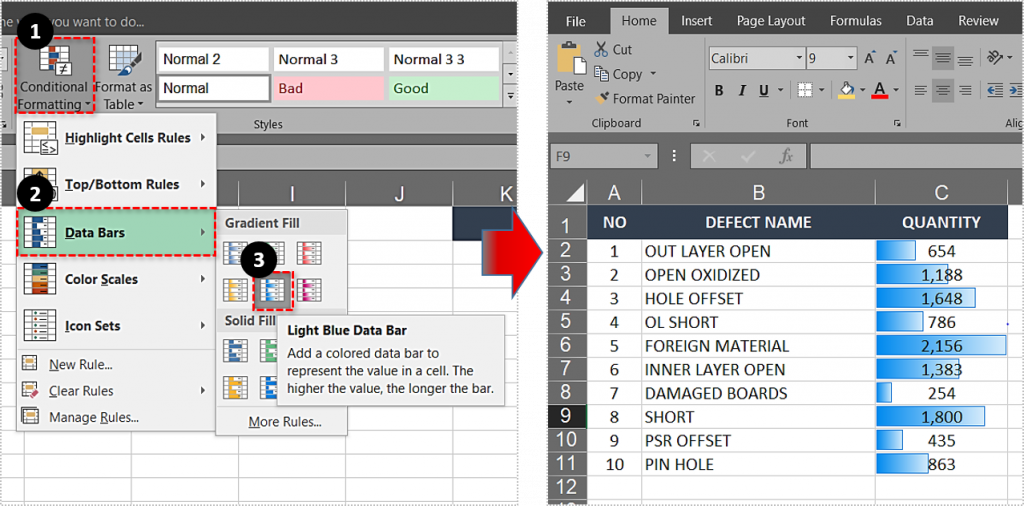
- Select the desired data range
- Go to the Home
- Navigate to Conditional Formatting -> Data Bars.
- Select the desired color and fill style.
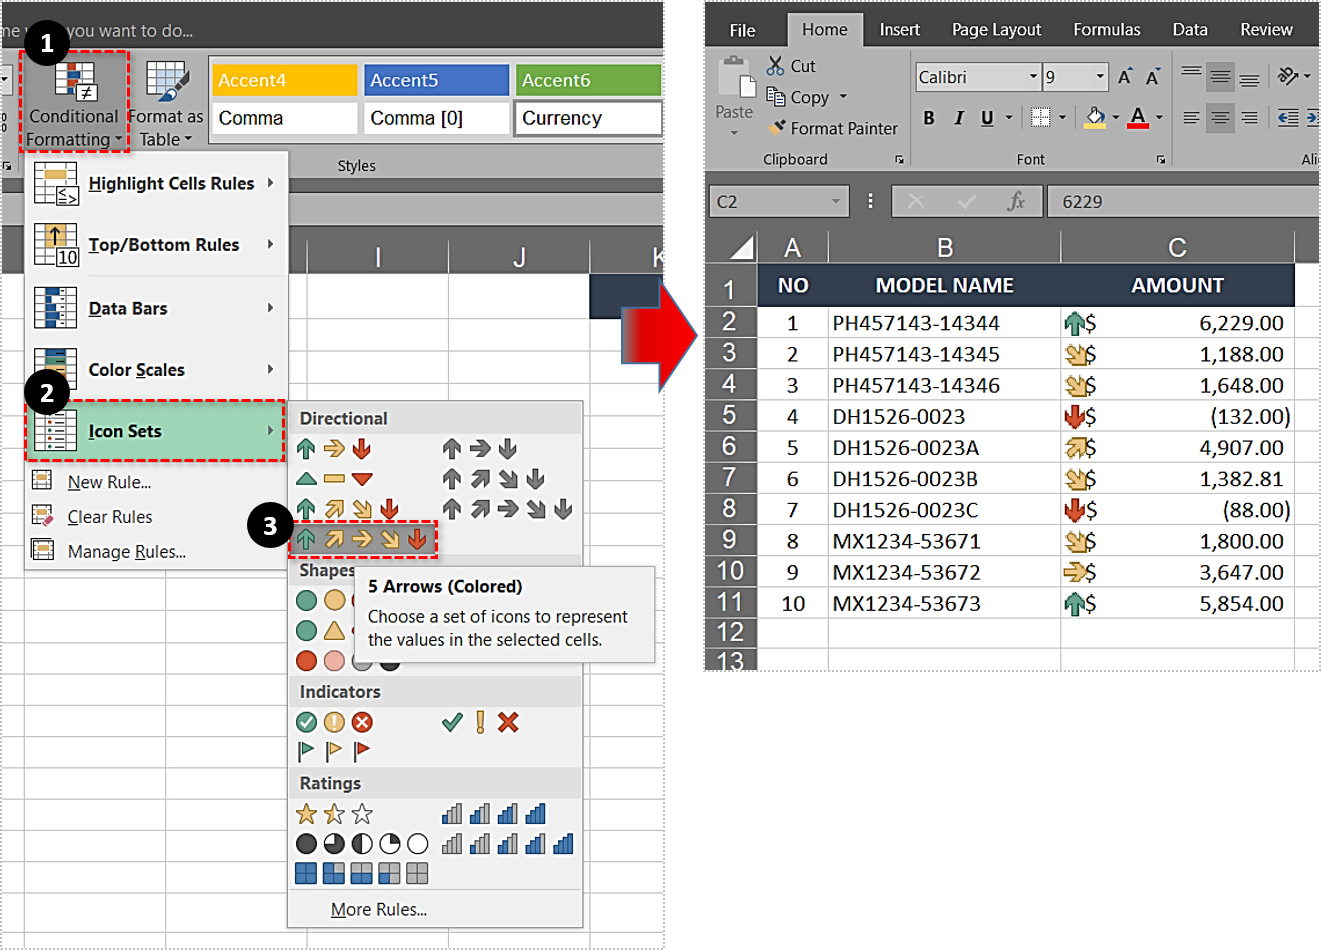
Highlight Positive, Neutral, and Negative Values with Icon Sets
This will show you how to custom set the positive, neutral, and negative values next to items. This is very useful for sales and revenue breakdowns.
- Select the column/range that you want to format.
- Go to the Home
- Navigate to Conditional Formatting -> Icon Sets.
- Choose the icon style that you want to use.
- Excel will automatically interpret your data.

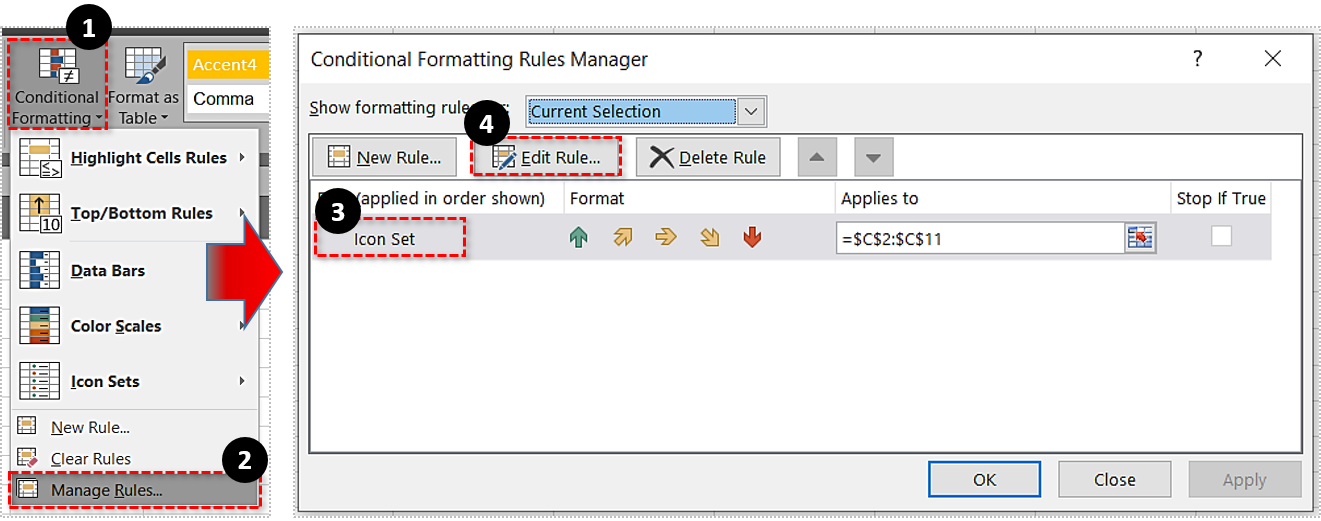
- If you want to change it, go to Manage Rules under Conditional Formatting.
- Choose the Icon Set rule and click Edit Rule.
- Adjust the rules according to your preferences.

Show Variances with Color Scales
Using the Color Scales under Conditional Formatting works pretty much the same way as the Icon Sets, only displays the result differently and with more gradients.
- Select the range.
- Find Color Scales in Conditional Formatting.
- Choose the color scale.

Smooth and Easy
Conditional formatting is pretty much basic formatting with some rule setting. Nevertheless, it is very useful and brings out Excel’s true nature – it’s more than a tool for table formatting, its an ultimate program for creating spreadsheets.
What interesting tips do you have to share about Excel? People who work with spreadsheets tend to have their own processes. How does your work? Hit the comment section below with any advice, tips, and questions.