


Utilities For PC Temperature Monitoring
One of the fundamental requirements of a well functioning PC is that it is cooled properly at all times. Today’s high- end systems include fast multi-core processors and often multiple graphics cards – components that offer great performance, but also generate a lot of heat. While care must be taken to ensure that the PC is properly cooled using a suitable heatsink/fan (HSF) combination and effective case ventilation, it is equally important to monitor critical temperatures (i.e. the CPU, graphics card, or motherboard) to make sure components are operating within their manufacturer mandated specifications.
Thankfully, most modern motherboards will include temperature monitoring software from the manufacturer when purchased. This software will usually let you monitor the motherboard and CPU temperature, and sometimes even more. However, there are also a host of free monitoring utilities available on the web for your PC that will provide you with a great deal of helpful data and information regarding the temperature of its components. In this article, I will introduce you to a few of them.
Processor (CPU)
A few utilities exist today whose main purpose is to monitor the CPU’s temperature and provide you with additional (cpu-related) information. One such utility is RealTemp.
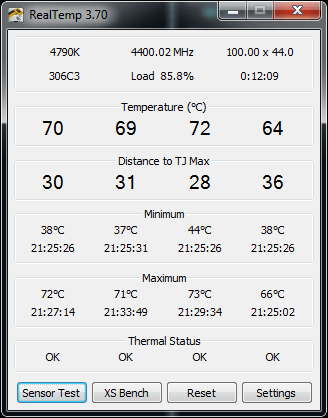
RealTemp displays basic information about your CPU’s model and speed (both the bus speed and the multiplier), current CPU load, as well as temperatures of each of the CPU’s cores. One further piece of useful information this utility also shows is the distance (in degrees) that the current CPU temperature is away from TJ Max (or maximum junction temperature). Once TJ Max is reached, the processor is running too hot and will begin to throttle itself back so as to prevent permanent damage. RealTemp also keeps track of historically observed minimum and maximum temperature, which can be seen at the bottom of the main window.
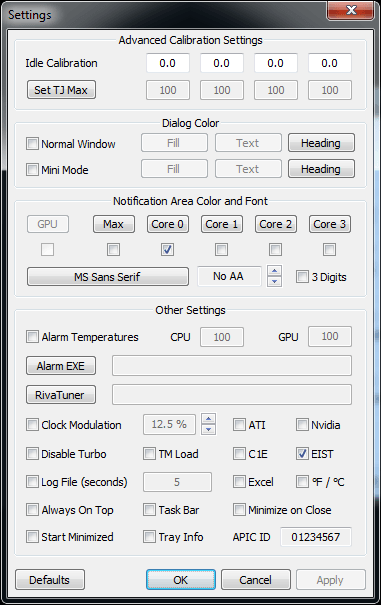
RealTemp is quite configurable and a host of options are available to the user under the Settings menu (bottom right most button). Once there, one can adjust Idle Calibration, the TJ Max temperature, and setup various notifications. More recent versions of the utility will now also provide basic GPU monitoring (more on that in the next section).
Finally, there are also a couple testing/benchmarking options included in RealTemp: One of these will make sure sensors are working (Sensor Test), and the other will run a short benchmark on the CPU (XS Bench).
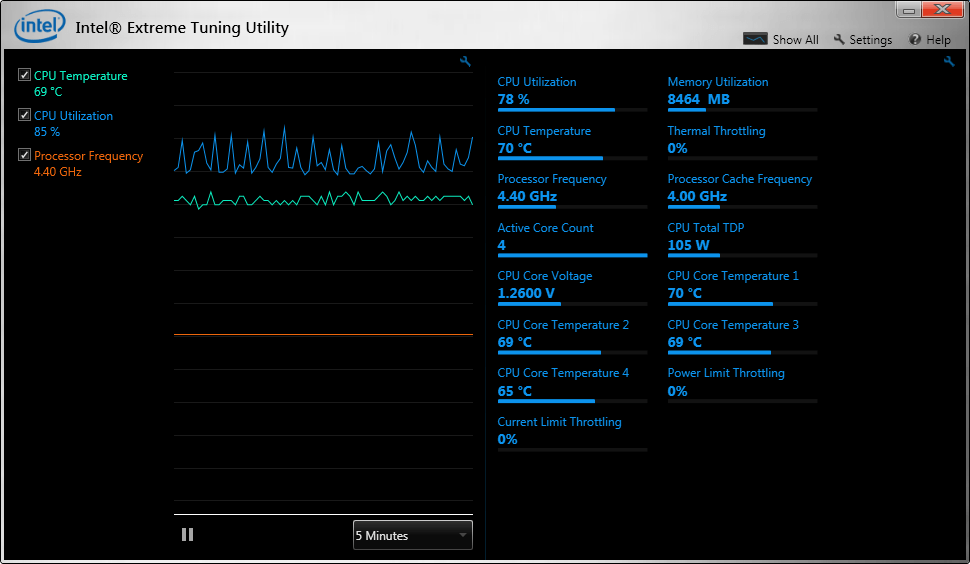
A second utility designed specifically for Intel processors which provides detailed temperature information is the Intel Extreme Tuning Utility (Intel XTU). While the primary purpose of this software is to help you tweak and tune your Intel processor from inside the operating system, it can be used for monitoring as well. Along with CPU and core temperatures, the Intel utility provides additional useful information, such as the CPU’s present total thermal design power (TDP), CPU voltage, and any current limit, power limit, or thermal throttling that may occurring (recall that thermal throttling can occur if the CPU meets or exceeds TJ Max, as mentioned above).
Graphics Card (GPU)
For graphics card specific temperature monitoring and information, a great free utility has been developed called GPU-Z.
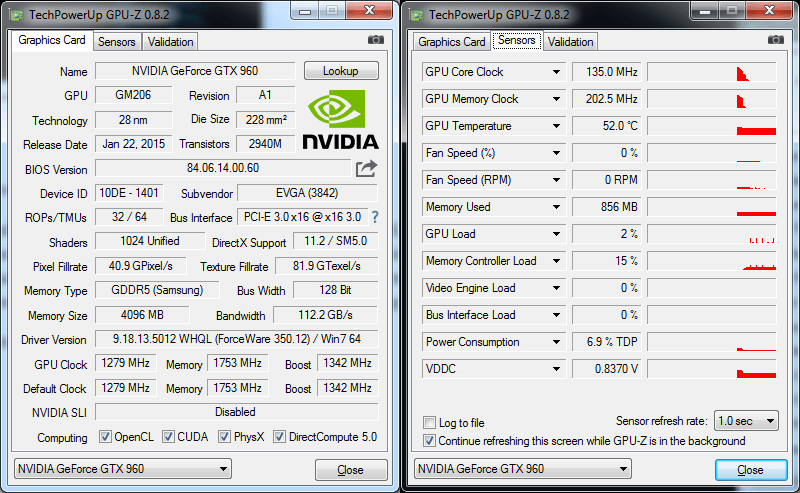
GPU-Z displays detailed information about the graphics card in your system, including GPU mode/type, amount and type of memory on the card, along with GPU and memory speed (frequency) information. To make things even nicer, the utility also displays the current BIOS and driver versions of the card that is being monitored. Temperature information is displayed on the next tab, which is the Sensors tab. Here one can see the current GPU and memory clock speed, GPU temperature, and GPU load. Additional information is provided as well, including fan speed, memory controller temperature and load, along with power consumption (as a % of thermal design power) and voltage. While it may seem overly detailed, this information is very useful to have, especially if you are considering overclocking your graphics card. As a final note, depending on the exact graphics card you have, additional voltage and temperature sensor information may be displayed in GPU-Z’s Sensor tab as well.
System/Other Components
For those that would rather see a more macro-level overview of their entire system a couple free utilities exist that will provide temperature monitoring information for multiple components at once, including the CPU, GPU, motherboard, hard drive(s), and more. The first of these utilities is called Open Hardware Monitor.
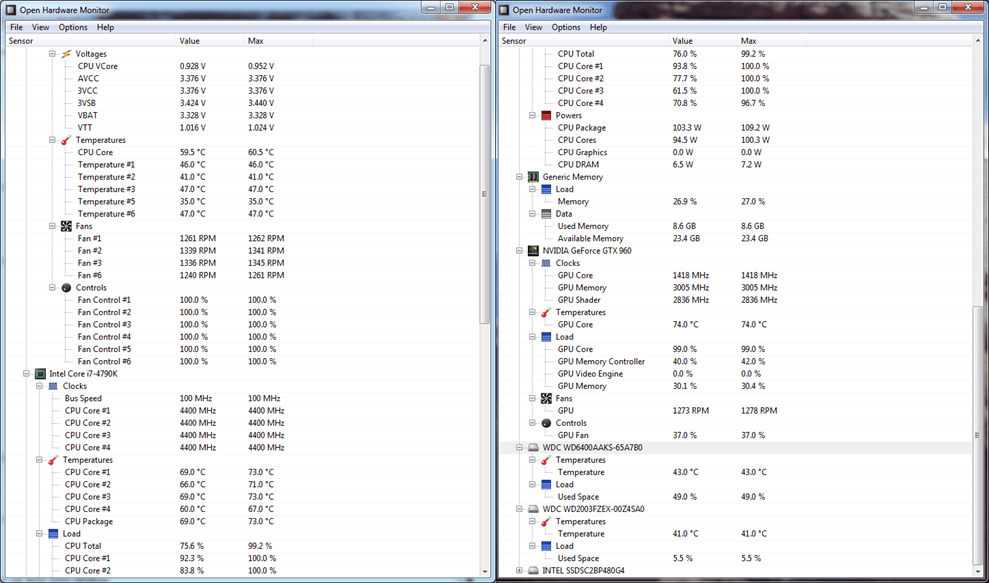
Open Hardware Monitor provides temperature information for the system’s motherboard, CPU, GPU, and hard drives. Along with this data, quite a bit of additional information is provided to the user, including voltages and frequency of the GPU/CPU, along with the amount of currently used space in memory and on any of the system’s SSD’s/HDD’s. Open Hardware Monitor also provides fan speed information – very useful data to have when 1) hardware overheating might be suspected, or 2) to ensure that a pulse width modulation (PWM) fan’s speed profile is working correctly (i.e. ensuring that the fan spins faster as temperature and load go up). Normally this data is displayed in the system’s BIOS, but having it available in the operating system is far more convenient.
Besides providing all monitored data in its main window, one can also setup a gadget in Open Hardware Monitor to display on the desktop to actively keep track of a subset of sensors. Plotting of temperature/sensor data is also supported for those that are interested in seeing data trends over time.
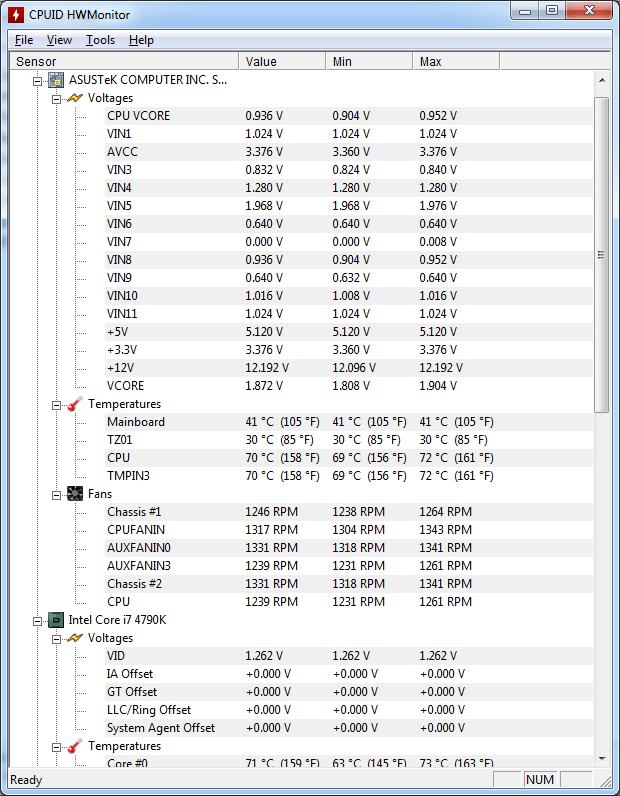
Another system-level monitoring tool worth checking out is CPUID’s HWMonitor. At the outset, HWMonitor is quite similar to Open Hardware Monitor in that it displays sensor based information for multiple components inside the PC. Similar to Open Hardware Monitor, temperatures are shown for the motherboard, CPU, GPU, and hard drives, including their current, max, and min recorded values. HWMonitor, however, does provide more detailed voltage information (including voltage information for the power supply) than Open Hardware Monitor, and the different fan monitors inside the utility were a little bit more descriptive (and thus easier to recognize). That being said, HWMonitor for some reason did not accurately report the speed (frequency) of my graphics card core when compared to the other utilities I tested (this may be due to a bug at the time of this writing; I was testing HWMonitor version 1.27). Finally, HWMonitor also allows you to save out your monitoring data, and there options to check for driver and BIOS updates (though I did not try these out).
Wrapping things up, this was just a sampling of free tools available today to monitor the temperature of your PC’s components. What is especially great is that all these tools go beyond their call of duty and provide useful supplementary information as well, which makes them worth adding to any PC enthusiast’s software utilities library. Beyond the tools I mentioned here, what other tools have you used and what tools would you recommend to fellow readers? Please share your thoughts below, or start a new discussion in our community forum.


2 thoughts on “Utilities For PC Temperature Monitoring”
However, i only use my computer for 1-2 hours at a stretch so I don’t think that monitoring temperature is something I should focus on.
Is that the right thing to do or should I install a tool to monitor the temperature?
It shows me all the temps, cpu, gpu, motherboard and cores. And I use core temp http://www.alcpu.com/coretemp
with it.
I use Ai suite 3 for my asus motherboard.
And Corsair link for my H100i to change fan speed on the cpu cooler.