

How To Add the CAGR Formula to Excel Spreadsheets
Excel is spreadsheet and accountancy software. The application has a variety of options, tools and functions for account spreadsheets. Many Excel users set up financial spreadsheets with the software. One financial indicator you can find in Excel is the common annual growth rate, otherwise CAGR, of an investment over multiple time periods.
What is the CAGR?
CAGR is a financial term used to measure average capital growth over multiple time periods. For instance, if you had a series of sales figures over a five-year period you could find the year-to-year growth rate. However, that would not a be single figure representing the overall growth rate over the full period.
As such, the common annual growth rate is basically an average rate of return on an investment, or rate of growth, over multiple time periods that takes into account the effect of compounding. CAGR is primarily an indicator that tells you how a number has grown in percentage terms over a number of years. The basic formula for the CAGR is: = EV / BV ^ (1/n) – 1. In this formula EV is the end value, BV is the beginning investment value and n is the amount of time periods (usually years, but can also be quarters, months, etc).
Adding the CAGR Formula to Excel Spreadsheets
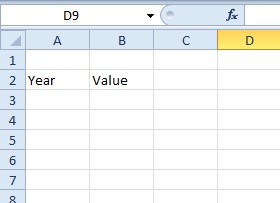
Excel doesn’t have a specific CAGR function. However, you can still find a common annual growth rate for a series of values with the CAGR formula outlined above. First, open a blank Excel spreadsheet; and enter ‘Year’ as a column header in cell A2. Enter ‘Value’ in cell B2 as shown in the snapshot below.
Now enter the years 2006-2010 in the cells A3-A7 in the Year column. Enter the following numbers in the Value column from B3-B7: ‘1234,’ 1789,’ ‘2565,’ ‘3232’ and ‘3876.’ Then your table should match the one shown in the shot directly below.
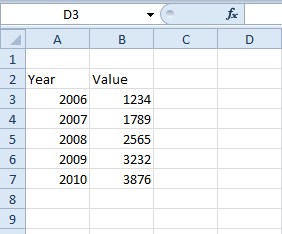
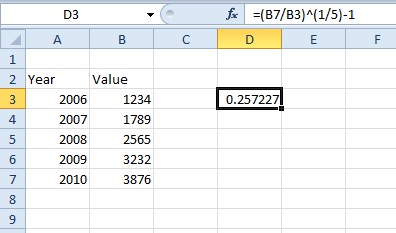
Now we can find the CAGR for the figures in the table. In this case, the end value is 3,876 (B7) and the start value is 1,234 (B3). The number of time periods included in the table is five. Thus, the CAGR formula for the table entered is: =B7/B3^(1/5)-1.
Select cell D3 in your spreadsheet as the one to include the CAGR formula. Then enter ‘=(B7/B3)^(1/5)-1’ in the fx bar, and press the Return key. D3 will return the value 0.257227 as in the shot directly below.
Now convert that value to a percentage format. You can do that by right-clicking D3 and selecting Format Cells from the context menu. Select the Number tab, click Percentage and enter ‘2’ in the Decimal places box. Press OK to close the window, and the CAGR value in D3 will then amount to 25.72%.
Calculating CAGR with the RATE Function
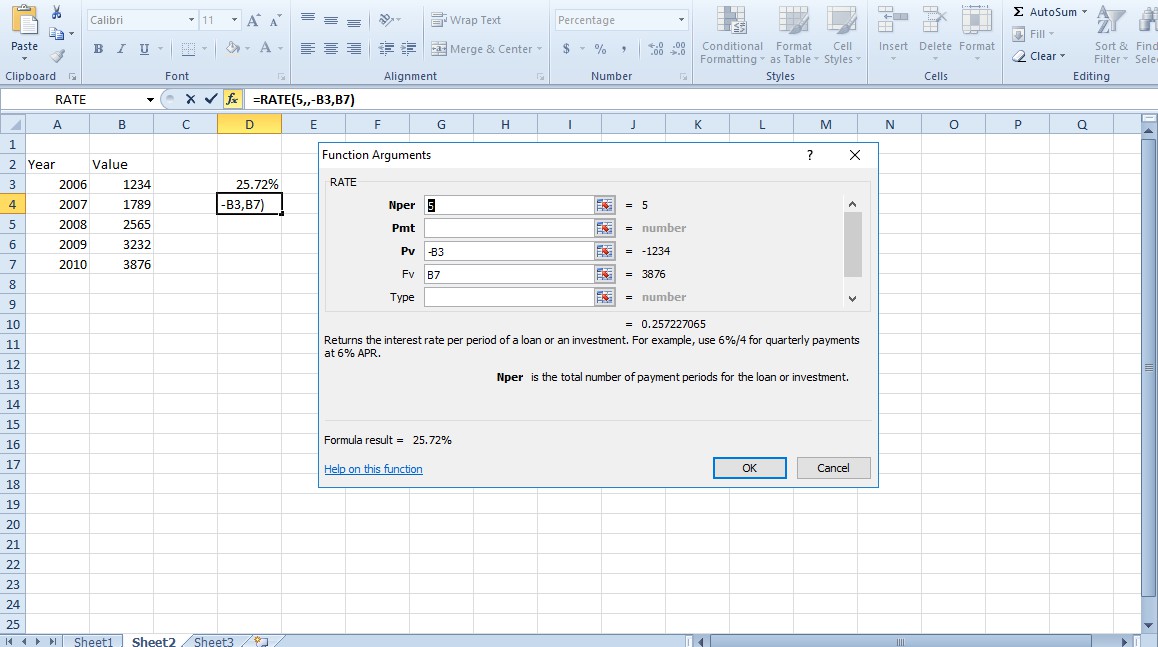
Alternatively, Excel users can find the CAGR with the RATE function. RATE is a function designed to return the interest rate per period for an investment. We can, however, turn that function into a CAGR formula by entering the beginning and end values in RATE’s Pv and Fv arguments. The actual formula looks something like this: =RATE(n,,-BV, EV).
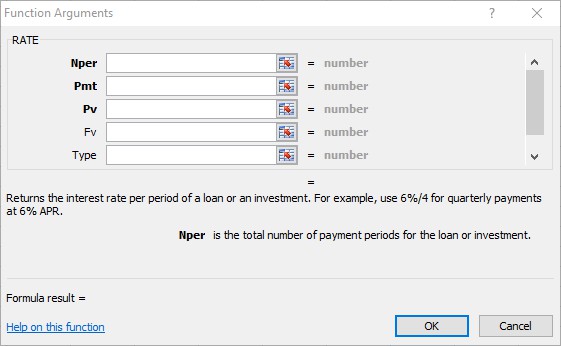
Return to the Excel spreadsheet where you added the first CAGR formula. Now select cell D4, which will include the RATE function. Click the fx button, select RATE from the Insert Function window and press OK to open the window shown in the snapshot directly below.
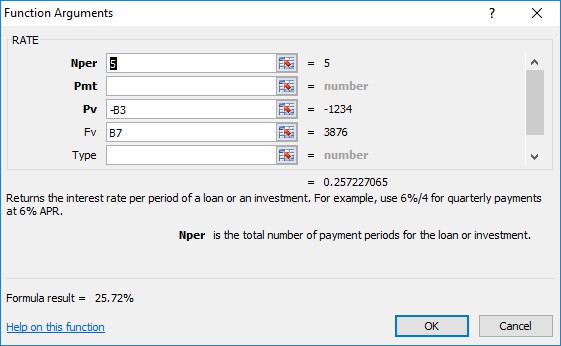
First, enter ‘5’ in the Nper text box as the total number of time periods. Then enter ‘-B3’ in the Pv text box as the beginning value. Note that value must be specified as a negative number for the formula to work. Enter ‘B7’ in the Fv text box, otherwise the end value, as shown in the snapshot directly below. You can leave the other function arguments blank.
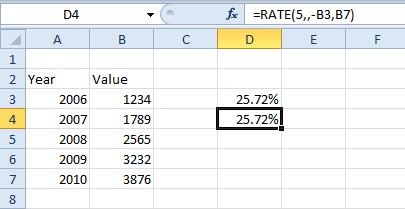
When you press OK, D4 might return a common annual growth rate value of 26% if the cell’s formatting isn’t configured to two decimal places. If you adjust the percentage format to display two decimal places from the Number tab, D4 will return the value 25.72%, which is exactly the same as the original CAGR formula entered in D3.
Those are two methods with which you can find the common annual growth rate percentage in Excel spreadsheets. You can also get a CAGR value with the POWER and XIRR functions. For further details, check out this YouTube page that includes a video which demonstrates how to add the CAGR formula to Excel spreadsheets.