


How to Find Quartiles in Google Sheets

Don’t let the fact that you didn’t like math in high school stop you from using all the handy options Google Sheets offers. Data analysis is much easier to perform since this program became available – percentiles and quartiles are undoubtedly one of the reasons why.
But what exactly are quartiles? How do you calculate them? Don’t worry. Google Sheets can do that for you. Keep reading this article to find out how.
What Are Quartiles and How to Calculate Them
You’ve heard about the median value of things. It’s the point at which 50% of all other values are below this point, while the other 50% is above. For example, people often mention it when they talk about the median salary or home prices in a city or a state.
Quartiles are similar. The same way you cut a whole in half to get percentiles, to get quartiles, you need to get four cuts. However, there are five quartiles, as you also count the starting point – the minimum, which is the 0th quartile.
You’ll find the first quartile at 25%. This means 25% of the values are smaller than the first quartile at this point. When you reach the median value, you also reach the second quartile. The third one is at 75%, while the fourth one represents the maximum. Note that these values are similar to MIN and MAX functions.

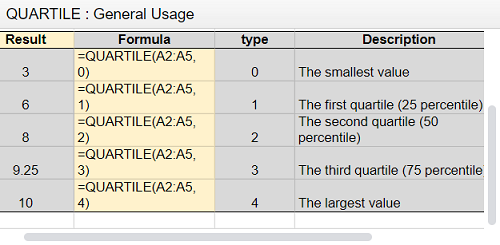
Google Sheets has a quartile formula that lets you calculate quartiles in a few seconds. For this formula, you choose the data range to analyze the quartile type. By using it, you can get a quite informative and systematic data summary, which is why quartiles are so important when you need to calculate statistics in Google Sheets. The formula is the following:
=QUARTILE (data,type)
For instance: QUARTILE (A2: A100, 3) Here, the formula will calculate the third quartile (75%) of data in the A2 row, cells A1-A100. You can see another example in the image below.
What Is the Interquartile Range?
IQR stands for the interquartile range. This range includes all the values located in the middle 50% of a specific dataset. How do you calculate this range? The formula is Q3-Q1, which means 75%-25%.
You can calculate this range manually. To do so, you need to order the data in the ascending order – from the lowest to the highest. Google Sheets helps you do this by using a formula. In this case, the data order doesn’t matter.
When you find Q3 and Q1, you can easily calculate the IQR. For instance:
Quartile (A2: A100, 3)-Quartile (A2: A100, 1)
How to Find Quartiles Manually
Some datasets will allow you to find quartiles manually in an easy way. Don’t forget you need to sort the data in ascending order to find the correct values.
For example, you can find the quartiles by eliminating the lowest and the highest value at the same time. Say you have the following dataset: 0 2 4 6 8 10 and 12. First, you eliminate 0 and 12. Then 2 and 10. After that, you remove 4 and 8. You’re left with 6, which is the median value, and the 2nd quartile at the same time.
Now it’s easier to find the other quartiles. The 0th is, of course, the minimum value, which is 0 in this case. The fourth one is the maximum, which is 12 in this particular dataset.
To find the first quartile, you’ll follow the same steps, but use the first half of the dataset: 0 2 4 6. Eliminate 0 and 6, and find the median value between 2 and 4, which is 3. That’s the first quartile – 25%. The third quartile is found when you analyze the second half of the original dataset: 6 8 10 12. Eliminate 6 and 12, and find the median value of 8 and 10, which is 9. It’s 75% – the third quartile.
Finding quartiles manually is simple when you have small numbers and simple data. For more complicated statistics, it’s recommended to use the formula. That will reduce the number of potential mistakes and save you quite some time.
Statistics Made Easy
It’s hard to imagine how much time you needed to enter, analyze, and share this kind of data years ago. Thanks to Google Sheets, finding quartiles and percentiles is made simple, and a large part of the process is automatically calculated. You may not have loved math, but this feature is very convenient, and you’ll appreciate it for sure.
Have you ever tried to find quartiles manually? How often do you need the quartiles formula? Let us know in the comments section below.


One thought on “How to Find Quartiles in Google Sheets”