

How to Make a Graph in Google Sheets

Knowing how to utilize all of the tools that Google Sheets gives you access to is essential. Working with a vast dataset doesn’t just require typing in every number you have into a spreadsheet file. You’ll need to illustrate data in graphs as well. While inserting Roman numerals in Google Sheets is easy; the same cannot be said for making graphs, especially if you are a beginner. However, the process is still reasonably easy to learn.
How to Make a Graph in Google Sheets
Graphs can help you organize your data in a form that’s easier to digest for everyone else. Aside from that, they have the added benefit of making your spreadsheet look more presentable. Google Sheets has built-in features for making graphs, making the process much easier.
- Open the spreadsheet in Google Sheets.
- Highlight the cells you want to illustrate.
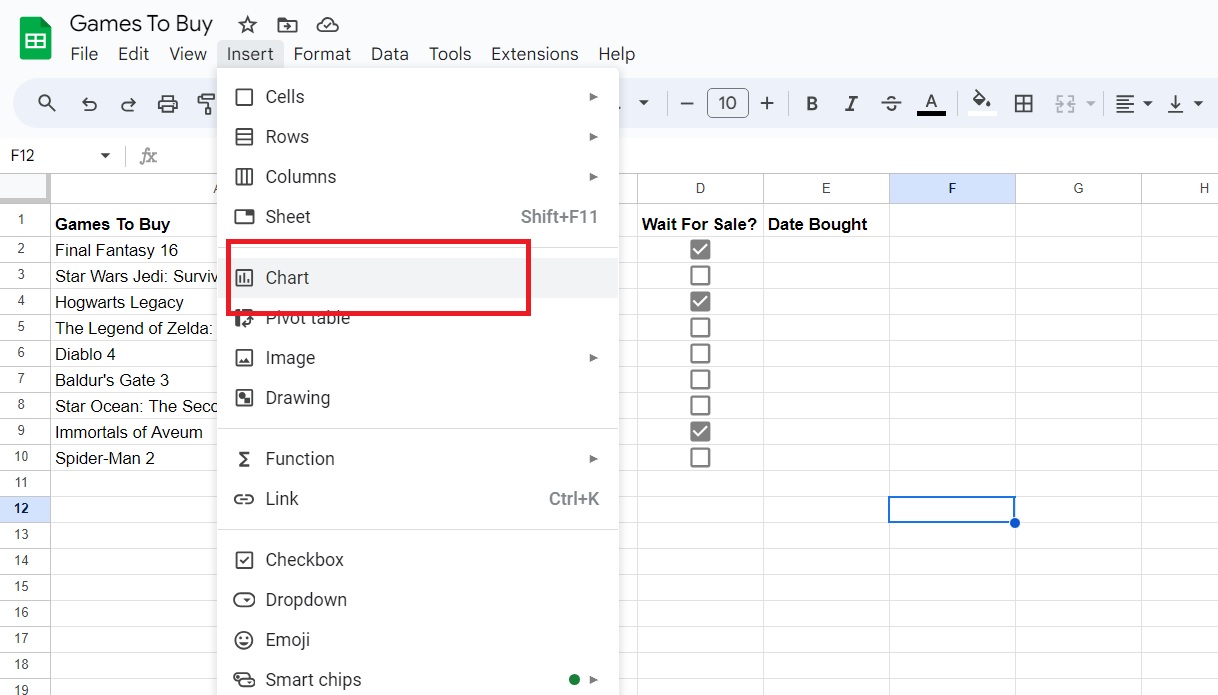
- Click Insert and select Chart.

- Customize your chart using the options on the right.

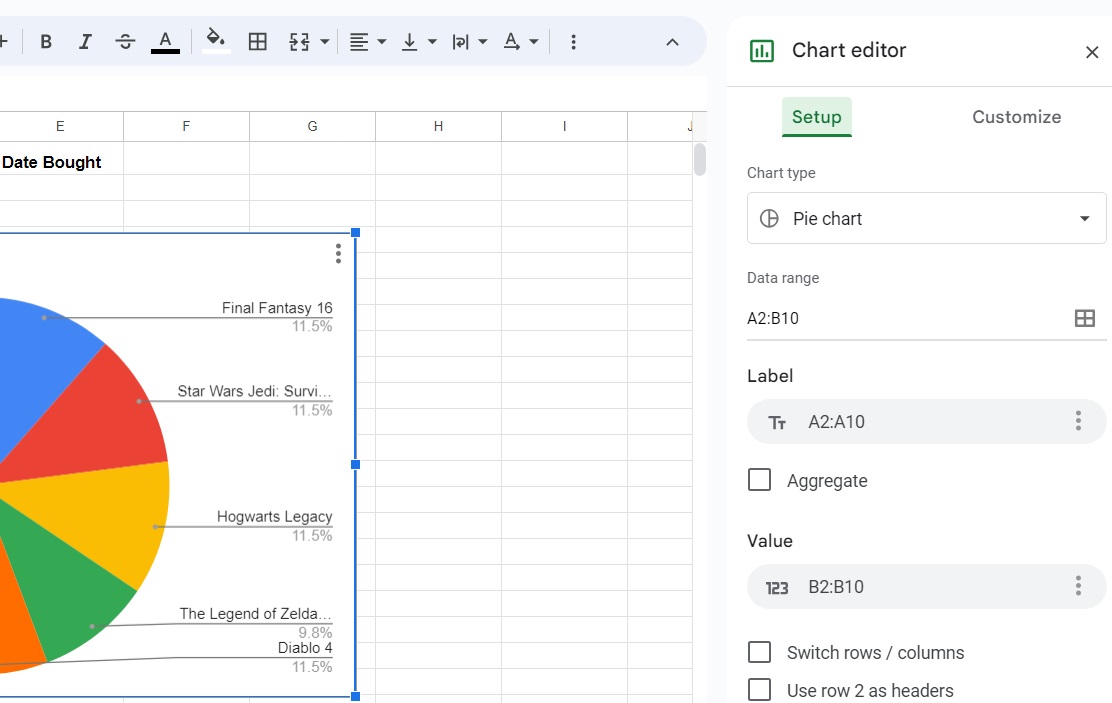
The chart editor will let you change labels, values, colors, and style. It’s also worth noting that you don’t need to highlight cells with data to create a chart. You can create one from scratch by clicking on an empty cell and then using the Chart feature.
For better visualization, you can alternate the row or column colors in Google Sheets.
How to Make a Bar Graph in Google Sheets
To make a bar graph in Google Sheets, you must first follow the steps above. Once done, click Chart type under Chart editor; scroll down until you see the different bar graph templates that Google Sheets has.
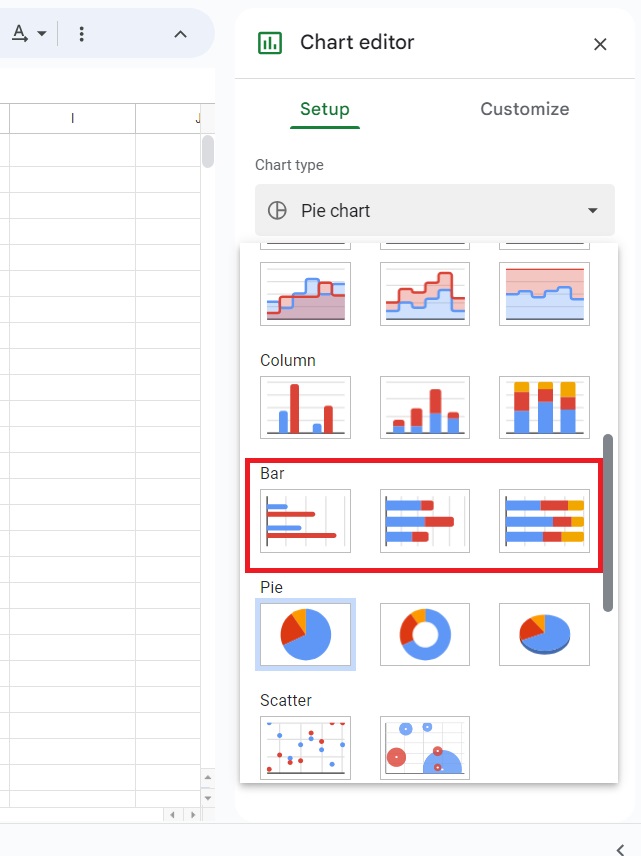
Bar graphs are best for comparing the change in data over some time.
How to Make a Graph in Google Sheets From Android or iPhone
If you’re on the road and don’t have your laptop to make a quick graph, the Google Sheets app can still help you out. To create a graph using the app on your phone, follow these steps.
- Open your spreadsheet.
- Highlight the cells with the data you want to turn into a graph.
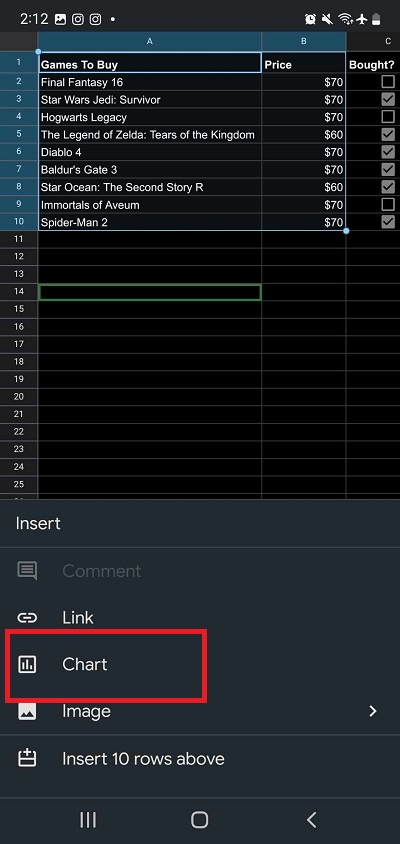
- Tap the plus icon.

- Select Chart.
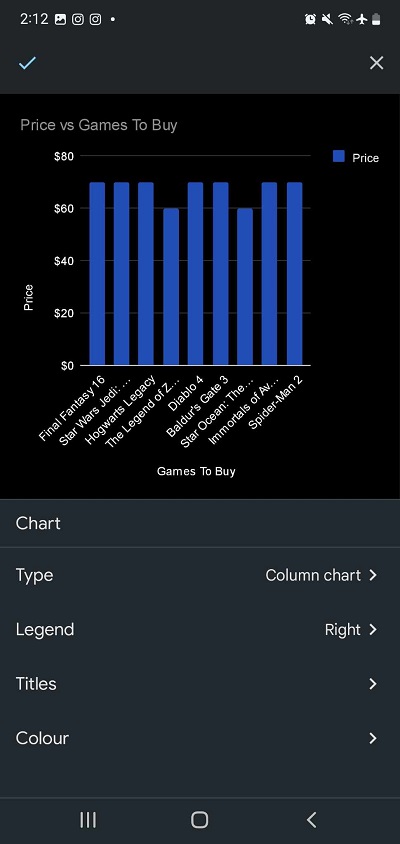
- Adjust and customize your chart using the chart editor.
- Tap the check icon at the top left once you’re done.
If you want to change chart types, tap on Type, and you’ll see a selection of recommended charts and templates for other types.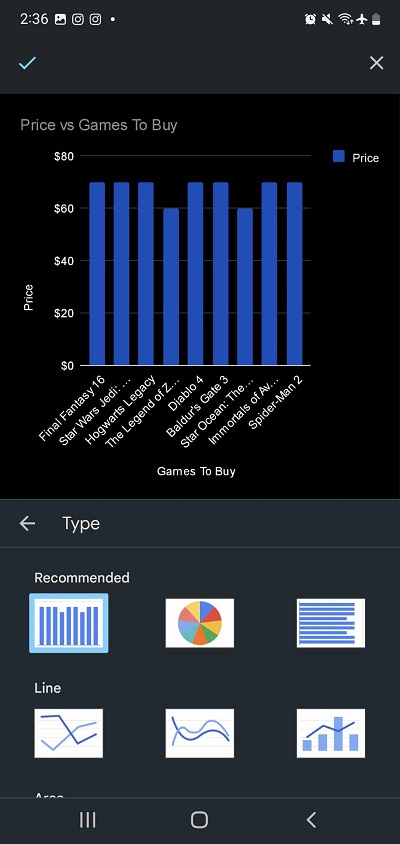
Illustrate Data With Graphs!
Graphs are going to be beneficial for you, as well as for those who are looking at your spreadsheet. It’s one of the best ways to simplify complex data that would otherwise look crowded when placed on cells. If you don’t want others messing with the data while creating charts, make sure to lock the rows and cells in Google Sheets.
FAQs
A: Yes, you can copy the chart and paste it to any Google Docs you own. You can paste it linked or unlinked to the original spreadsheet. Only those with access to the Google Sheet can edit the chart when linked.
A: You can make a graph in Google Sheets, copy it, and then paste it on your doc file. Alternatively, you can click Insert and add a chart from there.
A: You can add as many charts as possible on a single spreadsheet. You can even create multiple charts for a single data set.