
How To Monitor CPU Usage on Mac
If you’re turning into a Mac power user you might be interested to know about Activity Monitor. It works much like Task Manager and Resource Monitor in Windows and tracks resources throughout the system. It is present in most recent versions of MacOS and is a very useful tool for monitoring CPU usage and other stats.
Using Activity Monitor, you can quickly identify resource hogging apps or programs and see exactly what is going on within your iMac or MacBook. It’s a great utility to get to grips with, which is what this tutorial is all about.
Activity Monitor
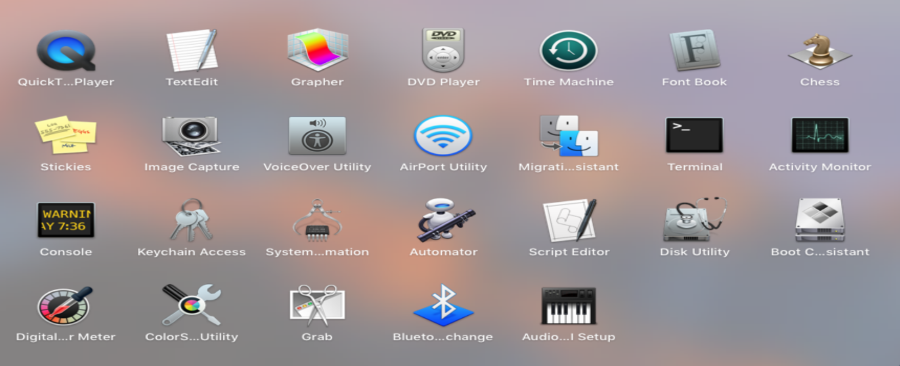
To launch Activity Monitor, select Applications, Utilities and Activity Monitor. You will be presented with a large window showing CPU usage with a scrolling display of the apps using percentages of CPU clock time in descending order. The app or process listed at the top is currently using the most CPU. Click the % CPU menu header to change the order.
At the top of the Activity Monitor window are five tabs, CPU, Memory, Energy, Disk and Network (the tabs are at the bottom in older versions of MacOS). They all relate to different resources within your Mac and should be largely self-explanatory. If you want to see what programs use the most RAM, click the Memory tab. If you want to see what is burning your MacBook battery, click the Energy tab. For disk utilization (not total storage) click Disk and for current network activity, hit Network.
Monitor CPU usage on Mac
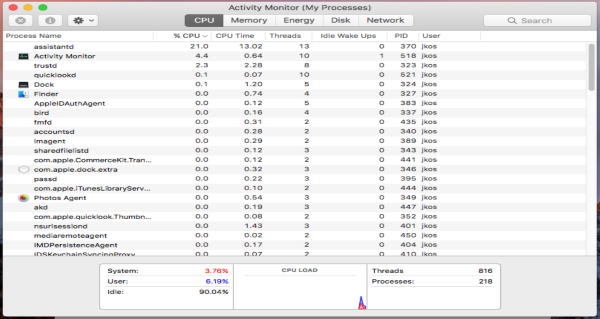
To monitor CPU usage on a Mac, keep Activity Monitor on the CPU tab. You can watch the total CPU usage of individual apps in the list and total utilization in the little graph at the bottom called CPU Load. Also at the bottom you can see what percentage of CPU is currently being used by the system and user and the idle process.
The idle process is a software loop that keeps the CPU working when not required. Computer processors cannot sit and do nothing or they lock up. An idle process is a low-level software loop that keeps it occupied when it is not required by other processes.
The other side of the window is a list of currently active threads and active processes.
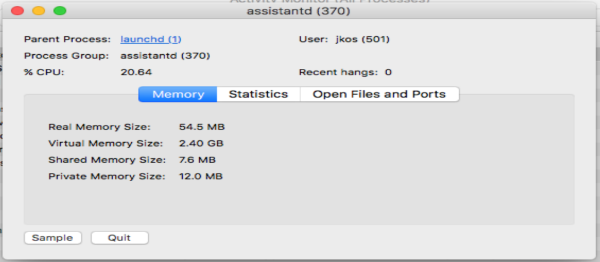
If you want to know more about a specific process in the list, just double click on it. A new window will appear listing the process, parent process, percentage of CPU it is using, the user who is utilizing the process and a range of statistics around that process. If you see a process listed that you cannot readily identify, you can use this window to find out the ‘owner’, i.e. what larger program or background process is using it. This is very useful in troubleshooting.
If you need to shut down a process, click Quit from this window and confirm or Force Quit. This will shut down the process immediately. This can be useful if you’re troubleshooting resources or trying to close an unresponsive app. Be careful what you close though!
Monitor RAM usage on Mac
The Memory tab works in much the same way as CPU. It lists all processes currently utilizing memory in descending order. You can watch memory statistics at the bottom of the window and keep an eye on memory used, cache, swap files and more. You can also watch how much ‘pressure’ your RAM is being put under, which is a measure of how much it is being used at the time.
Also like CPU, if you double click a process it brings up a further detailed window highlighting every aspect of that process. That includes how much real and virtual memory it is utilizing. The Quit and Force Quit options are available here too.
Monitor energy usage on Mac
The Energy tab is more useful for MacBook owners than iMac. It shows the current battery or energy utilization in real time. It also lists programs using the most power in descending order. This tab lists energy used, whether it has nap enabled or not and whether the app will prevent the laptop going to sleep.
Overall energy use is shown in the graph at the bottom of the window.
Monitor disk usage on Mac
Disk usage is much the same. This tab is concerned with disk reads and writes rather than disk space usage. It shows what apps and programs are currently reading from or writing to your disk in descending order. This can be useful if you see 100% disk utilization errors.
Like the other tabs, double click a list entry to see more information or to force quit a process. The graphs at the bottom show total reads and writes, current input/output of the disk and total disk usage for the session.
Monitor network usage on Mac
Finally, the Network tab. Like the other tabs, Network shows current network utilization in descending order. It shows sent and received bytes and packets, the PID of the process performing the activity and the user logged in. The graphs at the bottom show total packets in and out, current packets in and out and the total amount of data send and received for the session.
Again like the other tabs, you can double click on an entry to learn more about it and quit or force quit should the need arise. Network stats are more useful for administrators or laptop owners using a tethered cellphone but can also be useful for checking exactly what is talking to whom on your network.
MacOS does a pretty good job of managing system resources without human intervention but it also offers you the chance to do more. Activity Monitor is a very neat app that helps manage your system very effectively. If you live on or with your Mac, it might be worth your while getting to know Activity Monitor. You never know when it might help you troubleshoot a problem or isolate an erroring app.
Do you use Activity Monitor? Have any neat tricks that I haven’t mentioned here? Let us know below if you do!